# 小米智能插座通过米家接入HA然后接入koishi
多此一举的操作()
不想一步步详细贴出来,毕竟网上都有了,我还写几把(
# HomeAssistant 接入米家app的小米智能插座
# HomeAssistant 部署
可以看看官网,建议使用Docker
docker run -d \
  --name homeassistant \
  --privileged \
  --restart=unless-stopped \
  -e TZ=Beijing \
  -v /opt/homeassistant/comfig:/config \
  -v /run/dbus:/run/dbus:ro \
  --network=host \
  ghcr.io/home-assistant/home-assistant:stable
1
2
3
4
5
6
7
8
9
2
3
4
5
6
7
8
9
- 此处
/opt/homeassistant/config是docker映射到宿主机的配置文件路径 - 浏览器访问
http://<host>:8123 - 创建账号等操作
# HomeAssistant接入米家
- 在首页左下角(也许),打开
设置/配置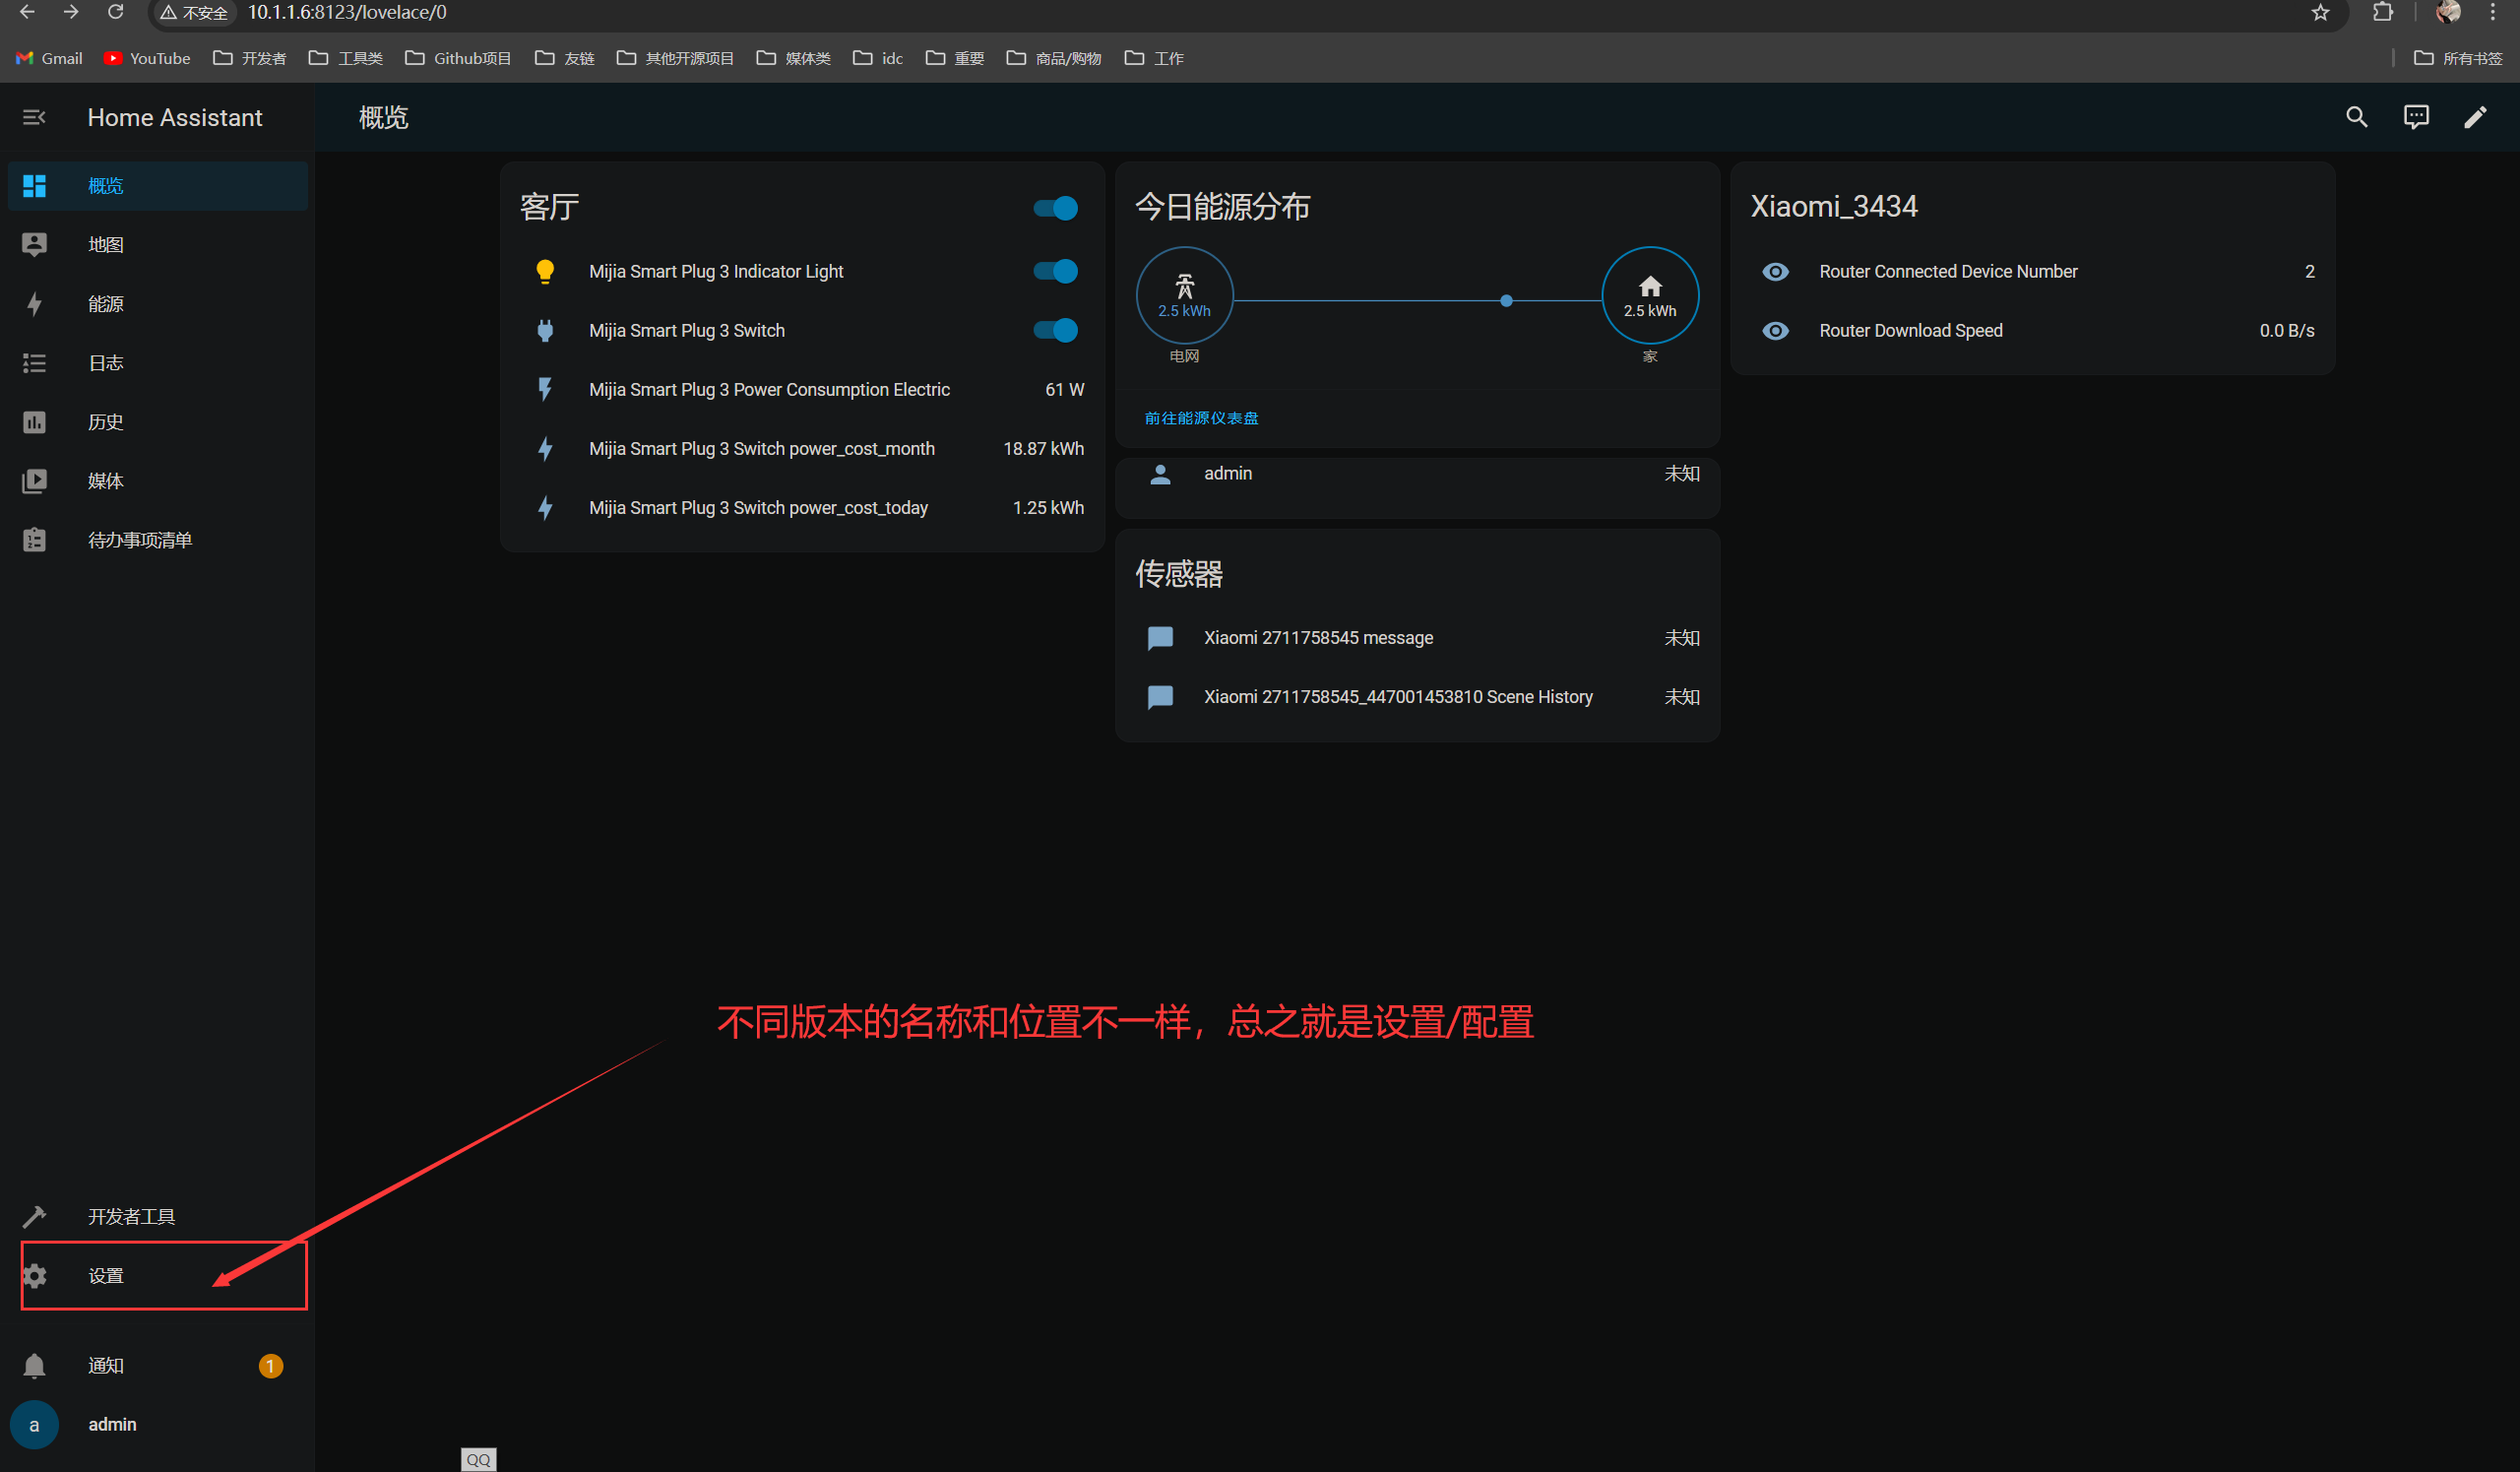
- 在首页左下角(也许),打开
- 然后打开含有
集成的配置项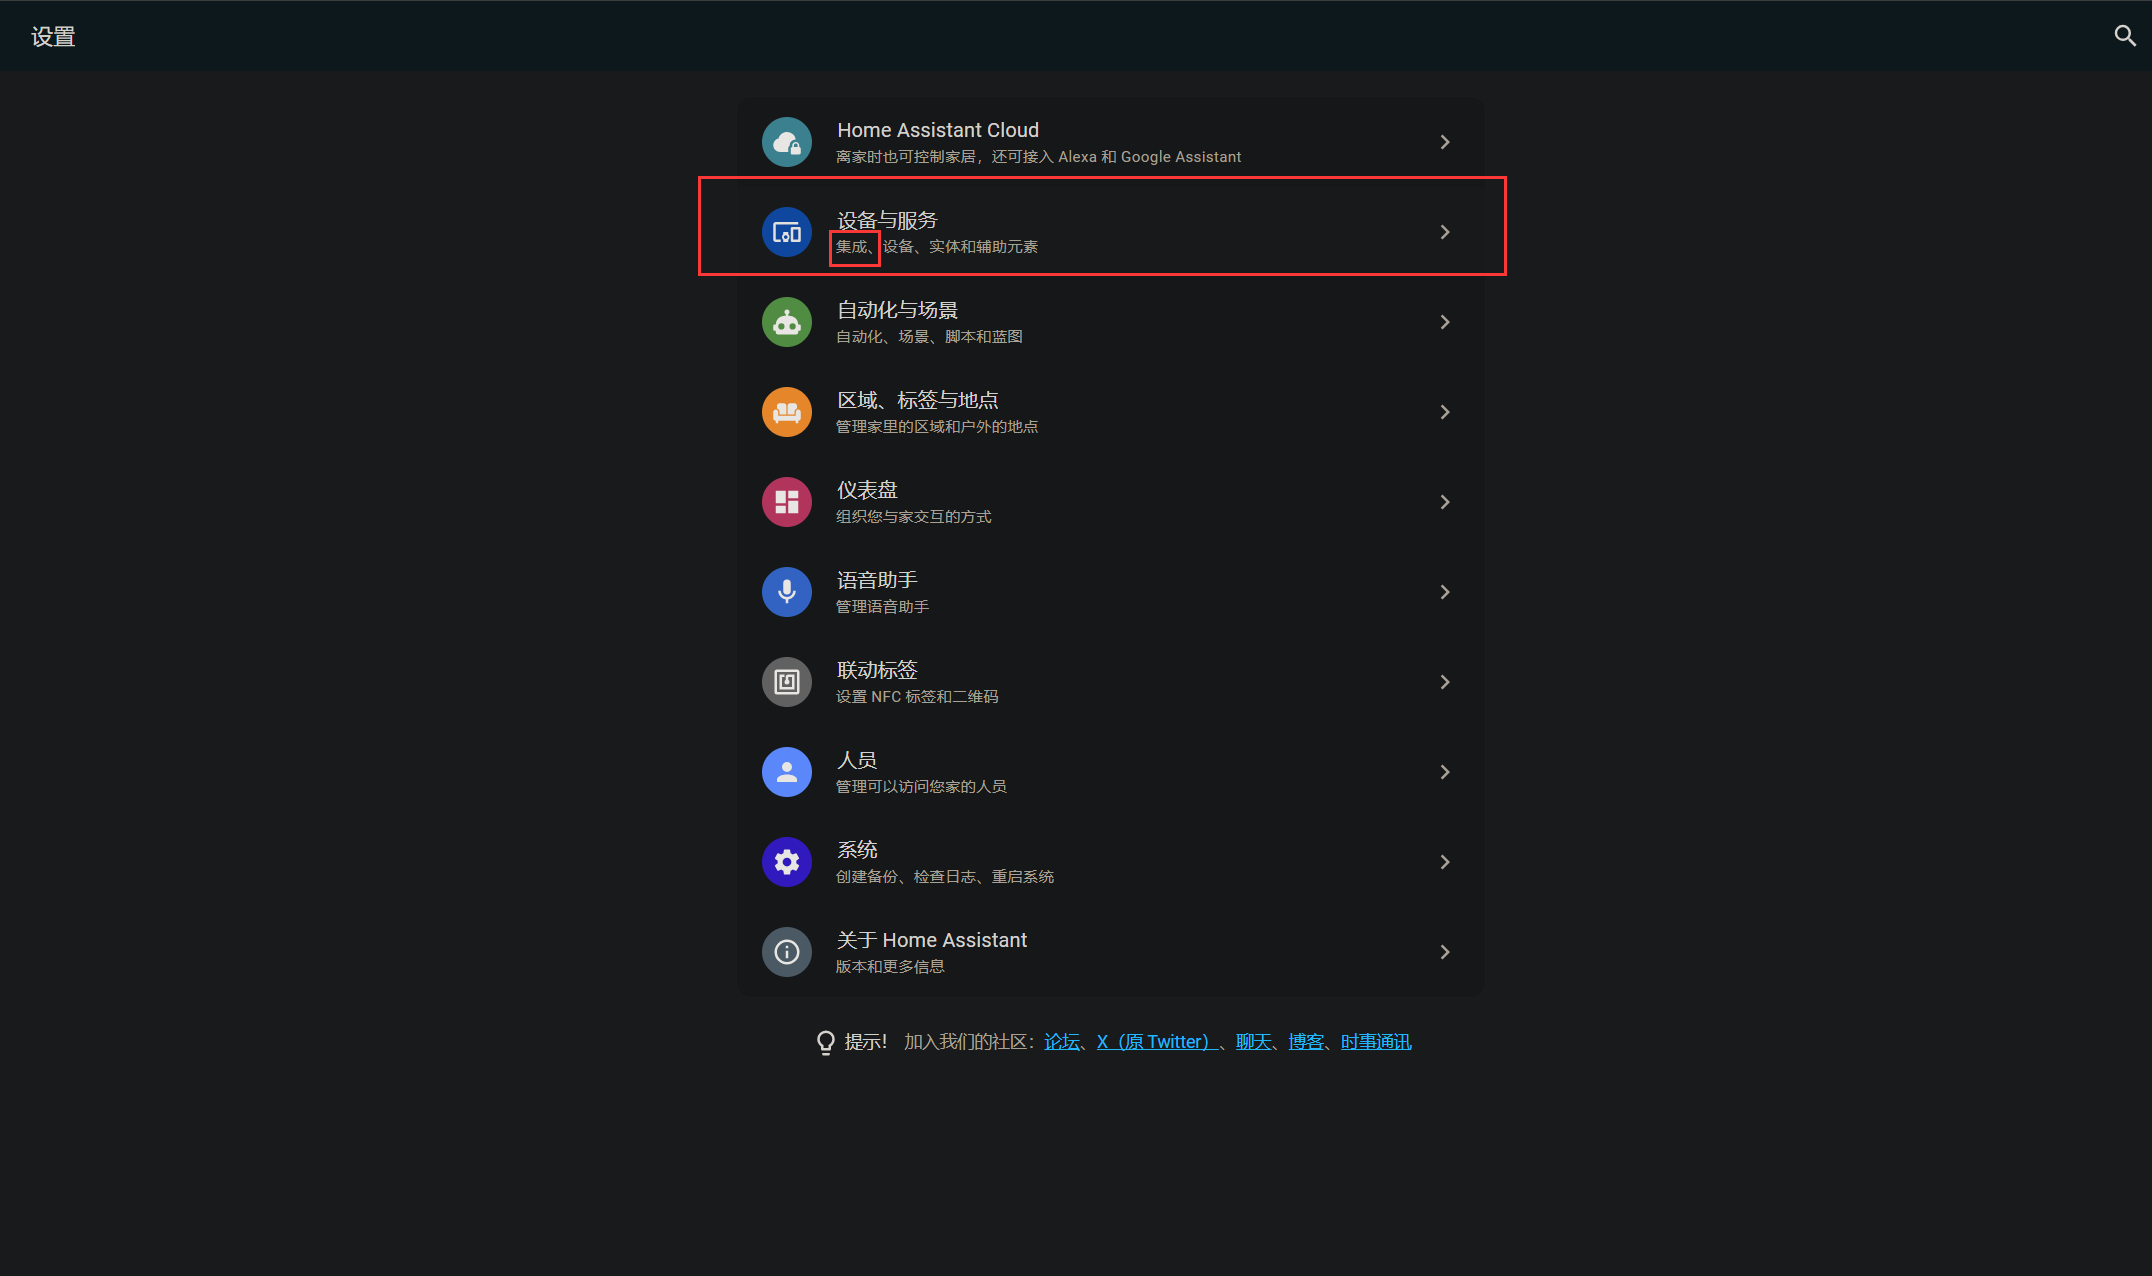
- 然后打开含有
- 添加集成然后在搜索栏搜索
xiaomi,选择xiaomi Miot auto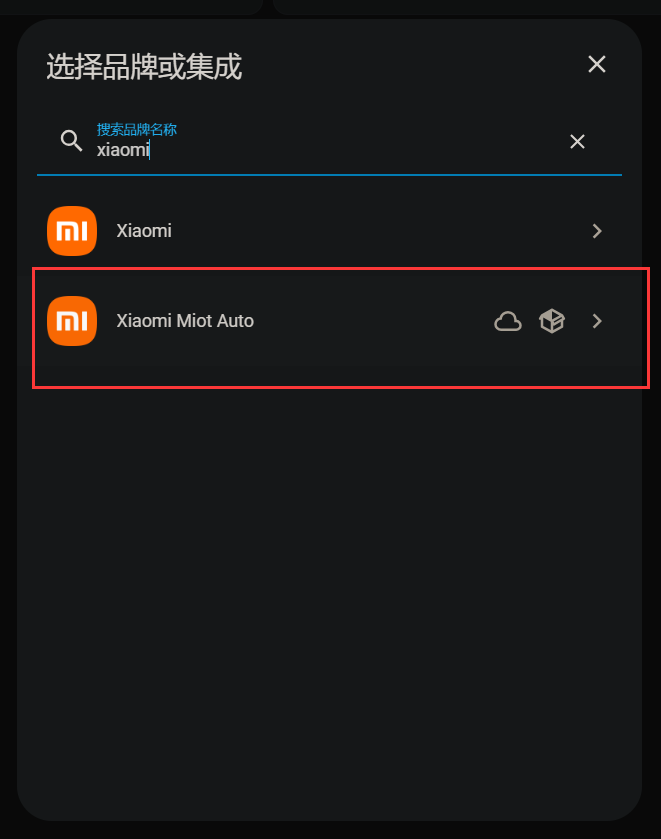
- 添加集成然后在搜索栏搜索
- 然后选择
Add devices using Mi Account (账号集成)(后面懒得截图了)
- 然后选择
- 填入账号密码,
Cloud (云端模式), 别选通过型号/家庭/WiFi筛选设备 (高级模式,新手勿选)
- 填入账号密码,
- 然后账号绑定的设备就显示在首页了
# koishi接入HA
- 需要在HA创建Token
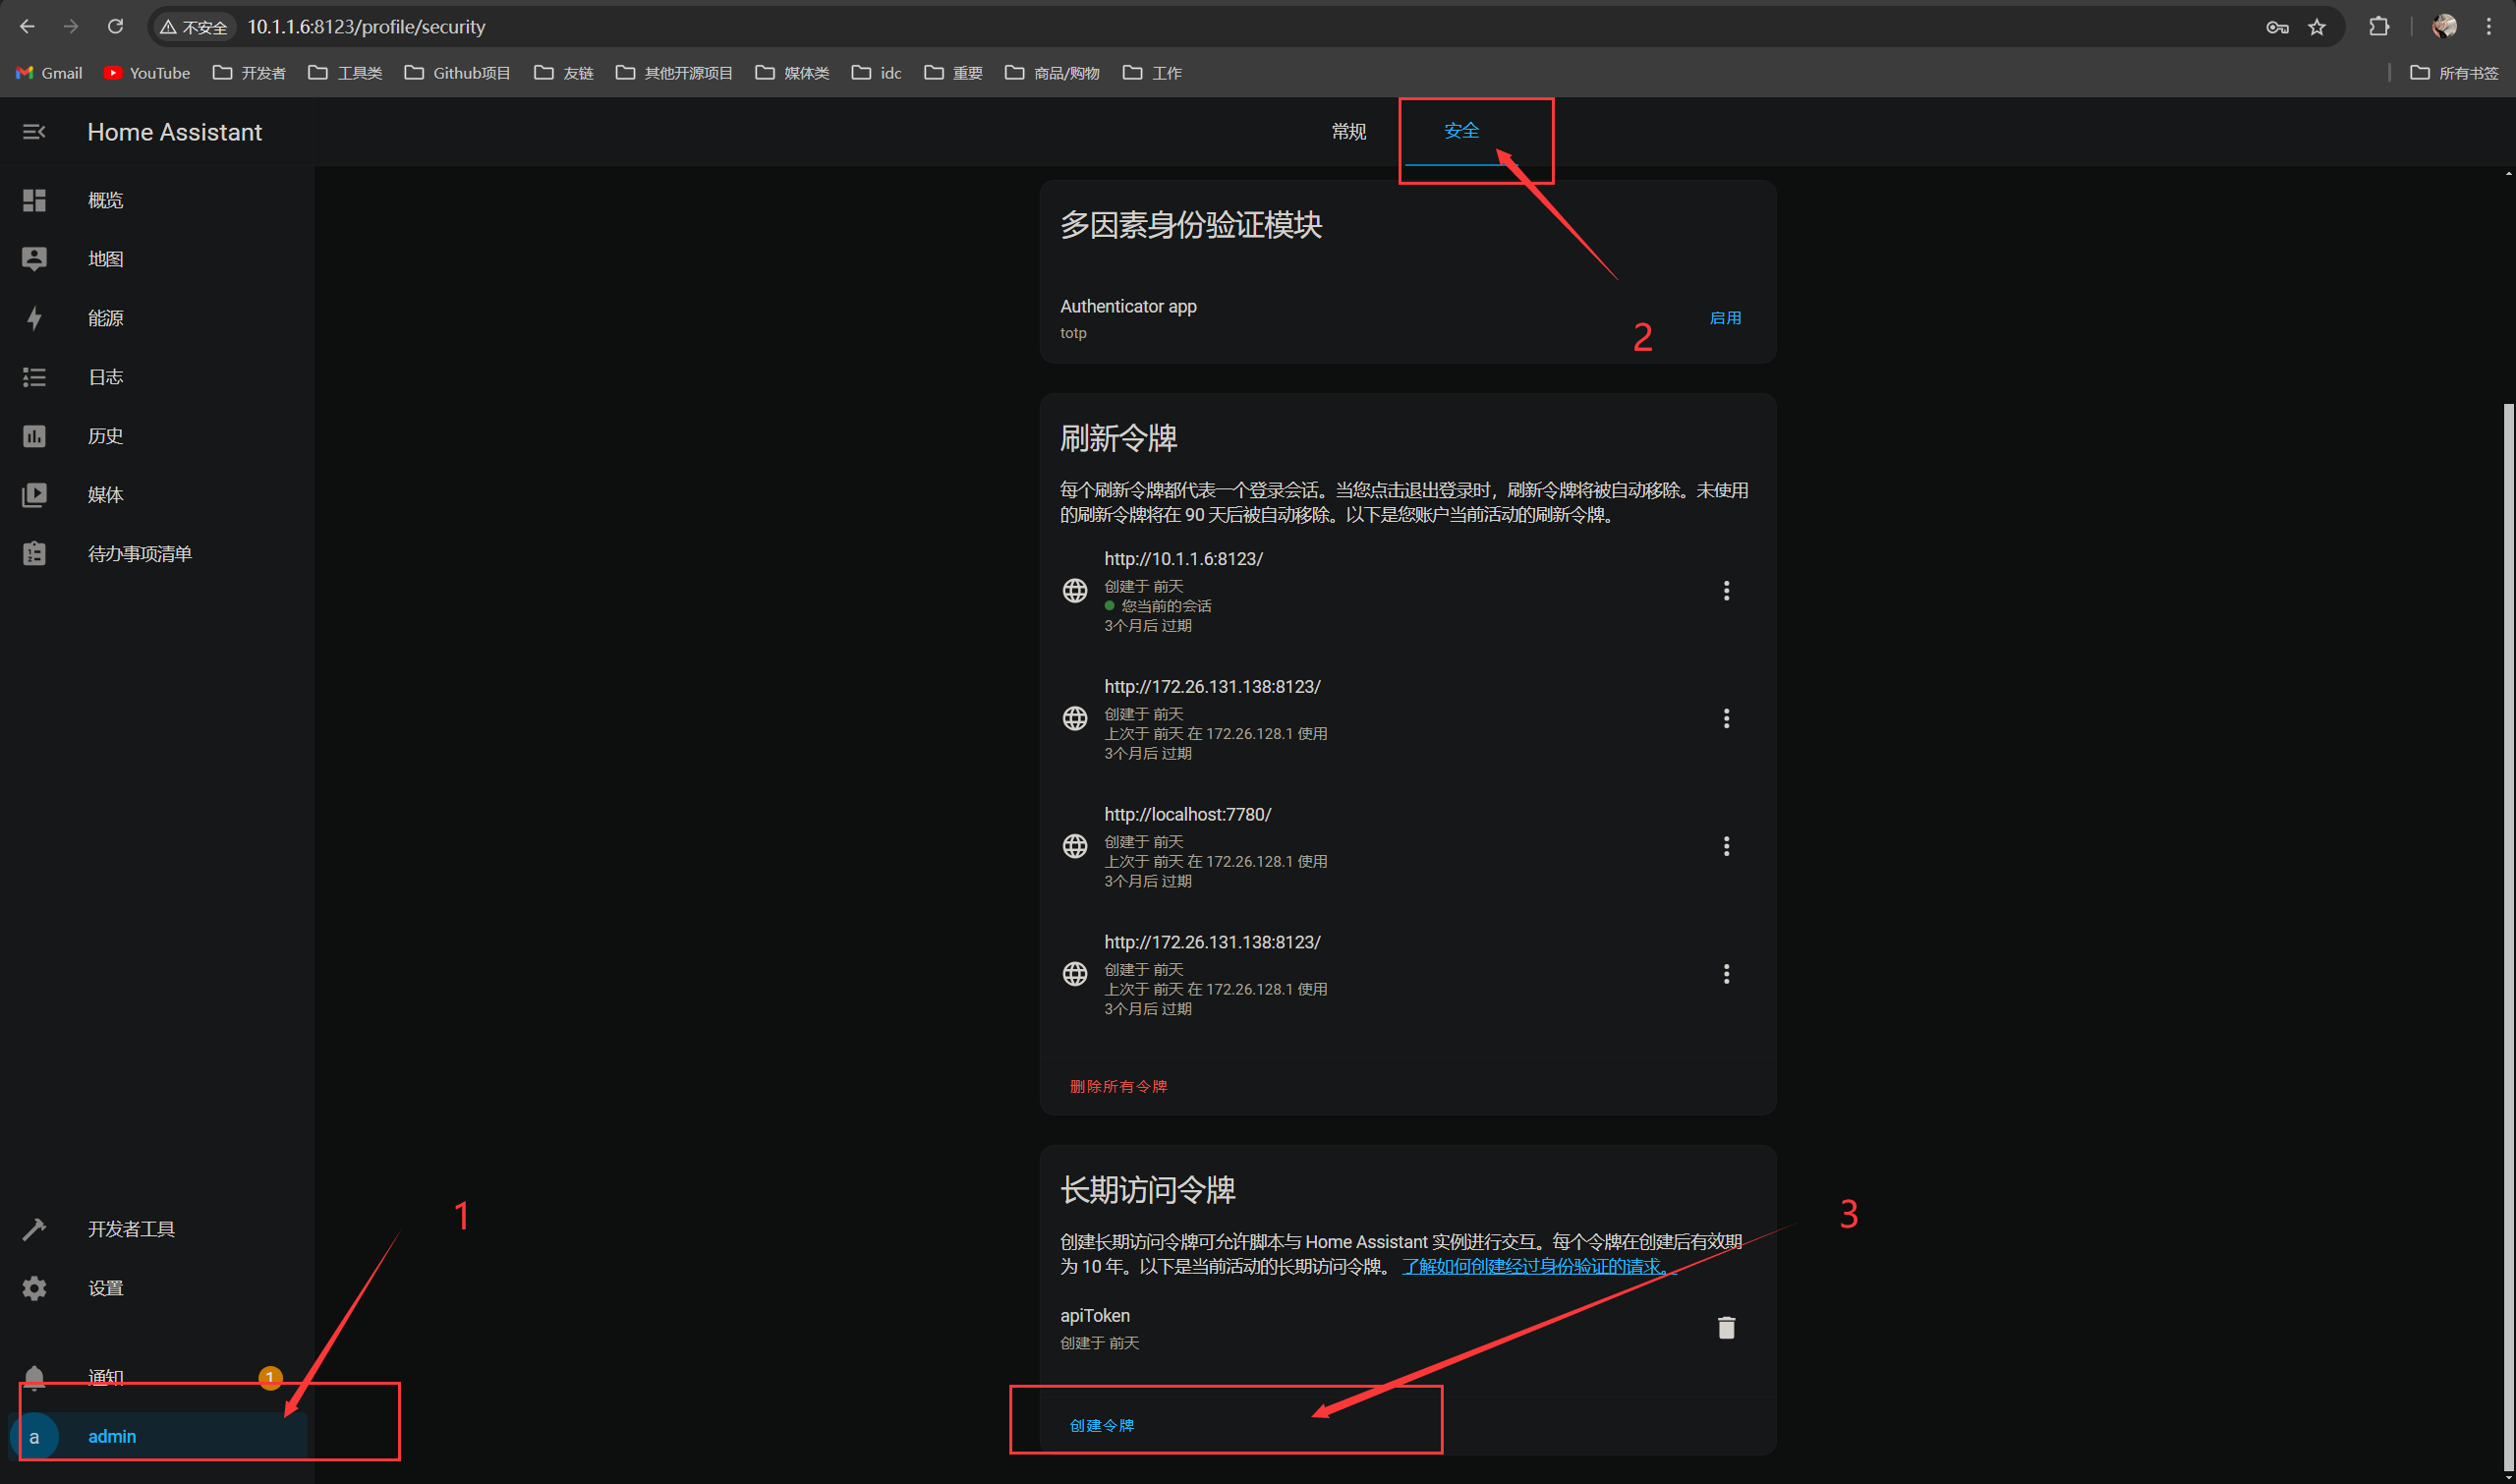
- 需要在HA创建Token
- 复制Token,记住这个Token
- 创建 koishi 插件, 为了更直观的的观测可以做成图表, 因此需要
puppeteer
- 创建 koishi 插件, 为了更直观的的观测可以做成图表, 因此需要
- 对了,这里说一下怎么获取传感器ID。
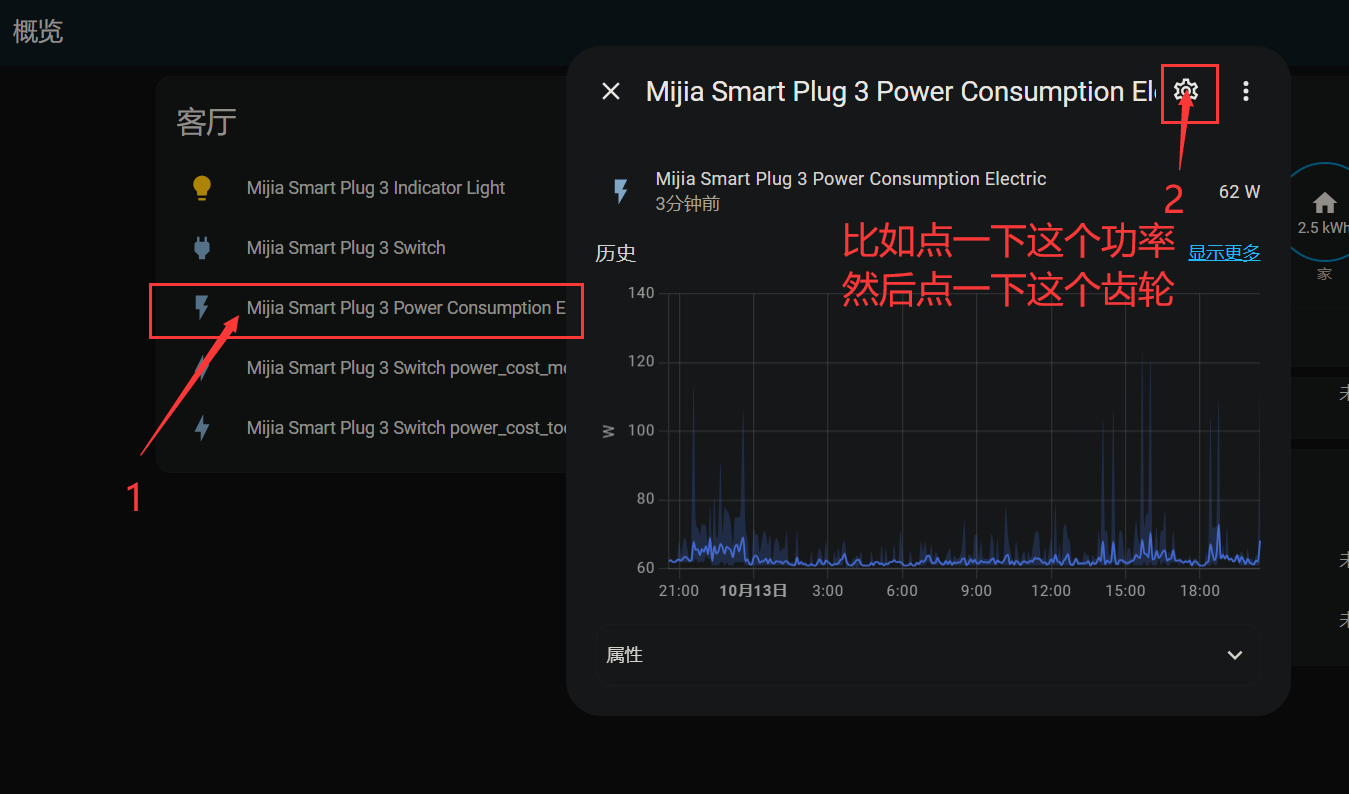
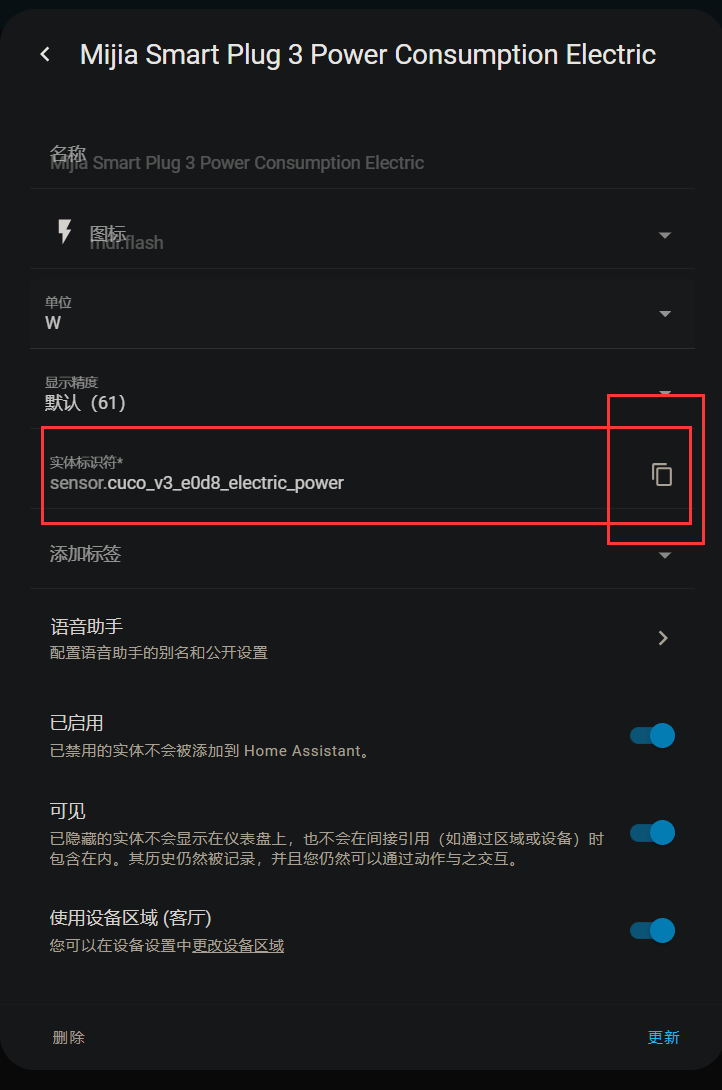
- 对了,这里说一下怎么获取传感器ID。
- 这个就是传感器的ID,也就是api里的
<entity_id>
- 这个就是传感器的ID,也就是api里的
koishi插件代码
See More
import { Context, Schema, h, sleep } from 'koishi'
import { resolve } from 'path'
import {} from "koishi-plugin-puppeteer";
import { Page } from "puppeteer-core";
import fs from 'fs'
import path from 'path'
export const name = 'mi-plug-status'
export interface Config {}
export const Config: Schema<Config> = Schema.object({})
export const inject = ['puppeteer']
export function apply(ctx: Context) {
// write your plugin here
const apiUrl = 'http://<host>:8123';
// 0:当前功率 1:今日用电 2:本月用电
const statusArray = ['sensor.cuco_v3_e0d8_electric_power','sensor.cuco_v3_e0d8_power_cost_today','sensor.cuco_v3_e0d8_power_cost_month'];
const headers = {
'Authorization': 'Bearer ${Token}',
'Content-Type': 'application/json'
};
ctx.command('miotshow [mode:number]', '获取米家设备状态(当前仅有米家只能开关)').alias('米家状态').alias('当前米家')
.option('text', '-t [mode:number] 文本模式')
.action(async ({session, options}, mode) => {
if (options.text) {
let powerData = [(await ctx.http.get(`${apiUrl}/api/states/${statusArray[0]}`, {headers})).attributes['electric_power-11-2'], (await ctx.http.get(`${apiUrl}/api/states/${statusArray[1]}`, {headers})).attributes['power_cost_today'], (await ctx.http.get(`${apiUrl}/api/states/${statusArray[2]}`, {headers})).attributes['power_cost_month']]
return <>
当前设备: 小米智能插座3(2022款)
当前功率: {powerData[0]}W
今日用电: {powerData[1]/100}度(kWh)
本月用电: {powerData[2]/100}度(kWh)
</>
}
let page: Page;
let data:any = await renderImage(ctx, mode);
// console.log(JSON.stringify(data.y))
session.send("请稍等,正在加速渲染图片>>>>")
try {
page = await ctx.puppeteer.page();
await page.setViewport({ width: 570, height: 352 });
await page.goto(`file:///${resolve(__dirname, "./template.html")}`)
await page.waitForNetworkIdle();
mode? await page.evaluate(`drawChart2(${JSON.stringify(data.y)}, ${JSON.stringify(data.x)})`):await page.evaluate(`drawChart(${JSON.stringify(data.y)})`);
// await new Promise(resolve => setTimeout(resolve, 1000));
await sleep(500);
const element = await page.$("body");
return h.image(await element.screenshot({
encoding: "binary"
}), "image/png")
} catch (e) {
console.log(e);
return '渲染失败' + e.message;
} finally {
page?.close();
}
})
}
async function renderImage(ctx: Context, type?: number) {
type |= 0;
const apiUrl = 'http://<host>:8123';
const statusArray = ['sensor.cuco_v3_e0d8_electric_power','sensor.cuco_v3_e0d8_power_cost_today'];
const headers = {
'Authorization': 'Bearer ${Token}',
'Content-Type': 'application/json'
};
const apiPath = '/api/history/period?filter_entity_id='+statusArray[type? 1:0];
let getData = await ctx.http.get(`${apiUrl}${apiPath}`, {headers});
let time = type? ((getData.flat().map(i => i.attributes.updated_time).reverse()).filter((time, index, self) => {
const dateHourPart = time?.toString().split('T')[0] + 'T' + time?.toString().split('T')[1].split(':')[0]; // 提取日期和小时部分
return self.findIndex(t => t?.toString().startsWith(dateHourPart)) === index;
}).map(item => item.toString().slice(5,14).replace('-','月').replace('T','日').replace(':','时'))):null;
let data = {
y: type? (getData.flat().map((item: any) => Number(item.state))).reverse().slice(0, time? time.length:13):(getData.flat().map((item: any) => Number(item.state))).reverse().filter((_, index:number) => type? null:(index % 5 === 0)).slice(0, 13),
x: time
}
return data;
}
1
2
3
4
5
6
7
8
9
10
11
12
13
14
15
16
17
18
19
20
21
22
23
24
25
26
27
28
29
30
31
32
33
34
35
36
37
38
39
40
41
42
43
44
45
46
47
48
49
50
51
52
53
54
55
56
57
58
59
60
61
62
63
64
65
66
67
68
69
70
71
72
73
74
75
76
77
78
79
80
81
82
83
84
2
3
4
5
6
7
8
9
10
11
12
13
14
15
16
17
18
19
20
21
22
23
24
25
26
27
28
29
30
31
32
33
34
35
36
37
38
39
40
41
42
43
44
45
46
47
48
49
50
51
52
53
54
55
56
57
58
59
60
61
62
63
64
65
66
67
68
69
70
71
72
73
74
75
76
77
78
79
80
81
82
83
84
template.html使用canvas画图
See More
<!DOCTYPE html>
<html lang="en">
<head>
    <meta charset="UTF-8">
    <meta name="viewport" content="width=device-width, initial-scale=1.0">
    <title>Line Chart Example</title>
    <!-- 引入 Chart.js 库 -->
    <script src="https://jsd.in0.re/npm/chart.js"></script>
</head>
<body>
    <h1 id="h1" style="text-align: center;">小米智能插座 | 1h功耗图</h1>
    <!-- 创建一个 canvas 元素来绘制图表 -->
    <canvas id="myLineChart" width="400" height="200"></canvas>

    <script>
        function drawChart(data) {
            // 获取 canvas 元素
            var ctx = document.getElementById('myLineChart').getContext('2d');

            // 配置图表数据
            var myLineChart = new Chart(ctx, {
                type: 'line', // 图表类型
                data: {
                    labels: Array.from({ length: 13 }, (_, i) => i? (i * 5+'min'):'now'), // X 轴标签
                    datasets: [{
                        label: '功耗, 单位: W', // 数据集标签
                        data: data, // 数据
                        fill: false, // 不填充折线下方的区域
                        borderColor: 'rgba(75, 192, 192, 1)', // 折线颜色
                        tension: 0.1 // 折线曲率
                    }]
                },
                options: {
                    scales: {
                        // x: {
                        //     min: 'February', // X 轴起点
                        //     max: 'June' // X 轴终点
                        // },
                        y: {
                            beginAtZero: false, // Y 轴不从 0 开始
                            min: Math.min(...data) - 10,
                            max: Math.max(...data) + 5
                        }
                    }
                }
            });
        }

        function drawChart2(data, y) {
            // 获取 canvas 元素
            var ctx = document.getElementById('myLineChart').getContext('2d');
            var h1 = document.getElementById('h1');
            h1.innerHTML = '小米智能插座 | 近期用电量';
            // 配置图表数据
            var myLineChart = new Chart(ctx, {
                type: 'line', // 图表类型
                data: {
                    labels: y,//Array.from({ length: 13 }, (_, i) => i? (i+'days ago'):'today'), // X 轴标签
                    datasets: [{
                        label: '用电量, 单位: kWh', // 数据集标签
                        data: data, // 数据
                        fill: false, // 不填充折线下方的区域
                        borderColor: 'rgba(75, 192, 192, 1)', // 折线颜色
                        tension: 0.1 // 折线曲率
                    }]
                },
                options: {
                    scales: {
                        // x: {
                        //     min: 'February', // X 轴起点
                        //     max: 'June' // X 轴终点
                        // },
                        y: {
                            beginAtZero: false, // Y 轴不从 0 开始
                            min: Math.min(...data)? Math.min(...data) - 0.2 : 0,
                            max: Math.max(...data) + 0.1
                        }
                    }
                }
            });
        }
    </script>
</body>
</html>
1
2
3
4
5
6
7
8
9
10
11
12
13
14
15
16
17
18
19
20
21
22
23
24
25
26
27
28
29
30
31
32
33
34
35
36
37
38
39
40
41
42
43
44
45
46
47
48
49
50
51
52
53
54
55
56
57
58
59
60
61
62
63
64
65
66
67
68
69
70
71
72
73
74
75
76
77
78
79
80
81
82
83
84
2
3
4
5
6
7
8
9
10
11
12
13
14
15
16
17
18
19
20
21
22
23
24
25
26
27
28
29
30
31
32
33
34
35
36
37
38
39
40
41
42
43
44
45
46
47
48
49
50
51
52
53
54
55
56
57
58
59
60
61
62
63
64
65
66
67
68
69
70
71
72
73
74
75
76
77
78
79
80
81
82
83
84
# 最后
- 以上是我的思路,当然代码烂了点,但是能用()
- 由于没有泛用性,这个代码就放在博客,不放github了,等后面还有想法完善插件再说
